What Recording And Documenting The Algorithms I Interact
With Taught Me
Keywords: Data visualization, Algorithmic literacy
Tools: Microsoft Excel, Adobe Illustrator, Laser Cutter
Algo.rhythm is an experimental data visualization project that explores the various digital (or computer) algorithms we interact with through the myriad interfaces that contain them.
I am intrigued by the interaction between humans and computers - the areas of overlap, the practice of co-creation, almost-collaboration that has become commonplace as traditional processes become automated. At a time when digital algorithms have been integrated into most systems and methods, it is interesting that individuals categorize it as “complex”, “mathematical”, and “incomprehensible”.
Can our interactions with these algorithms be visualized and made tangible? Will that change our relationship with them? Can simplifying and modularizing digital algorithms help demystify them? Can it reveal insights? Help us see patterns and connections that they might hold? Can it encourage us to pay more attention to the sheer complexity of algorithms that drive our simplest everyday actions?
Experimentation
I began by recording my daily interactions with digital algorithms, documenting all the little details. The first graphical representations were simple color-coded graphs that helped organize the data I was generating, and identify patterns.
I wanted to break down my actions into a neat list of algorithms it got me in contact with. The process made me realize that I had mistaken algorithms- multipart, complex systems- for simple, singular entities. Even my most basic actions incorporated multiple sets of algorithms that were difficult to determine. This information remained inaccessible to me as a private citizen. Partly, because corporations fiercely guard these systems that have become central to their operation, but also because often, even the engineers who program these systems only partially understand how they work.
I decided to focus on the interfaces that facilitated my interaction with algorithms instead. I visualized this data over the course of a day. In the figure below, each square represents a minute of my day. There are 60 squares in a row and 24 rows in all. The cross represents a minute spent without interacting with an algorithm. The colored circles represent interactions with different interfaces.
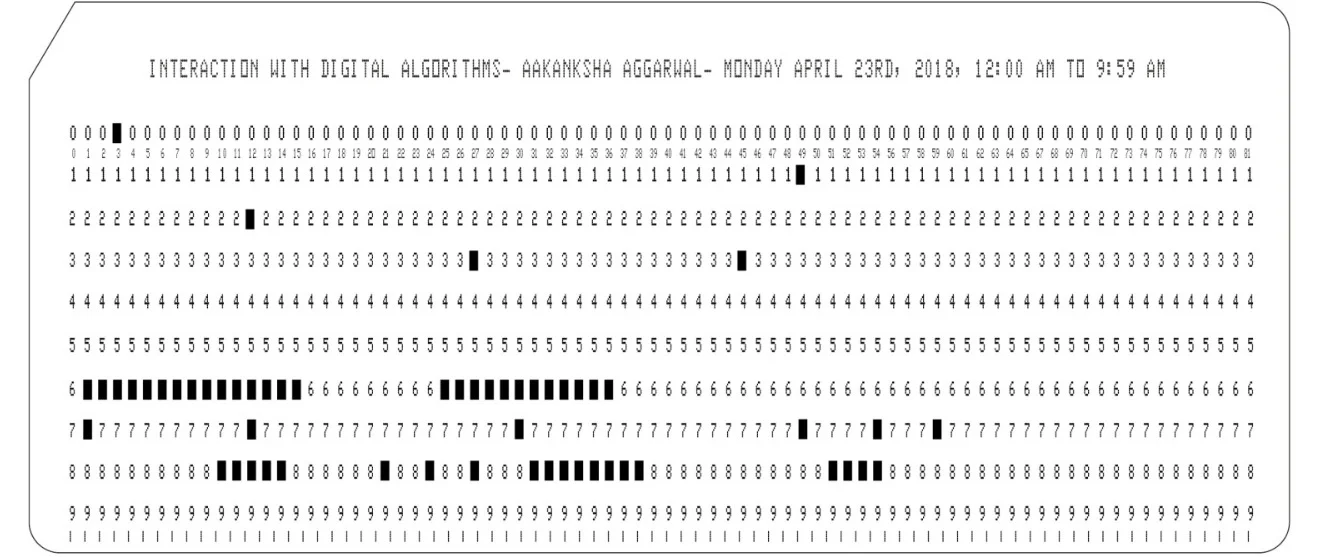
I distilled this information into a series of yes’s and no’s, 0’s and 1’s, interactions and non-interactions. This became the data set that the exploration was based off. I kept the grid intact and laser-cut squares corresponding to each interaction. The form was similar to a punched cards, that I had been introduced to while working in textiles. A punched card is a piece of stiff paper that contains digital information represented by the presence or absence of holes in predefined positions. Initially used to control Jacquard looms- they were soon adopted as the primary medium for storing information in early digital computers.
Digital systems have made it easy to generate, collect and store large amounts of data. We are producing data traces all the time without realizing it. The process of stitching my data, in comparison- was a manually tedious, time- consuming task, one that made me focus on the data itself and the meaning of what I was transcribing. The first "textile", was made using only two colors. The yellow stitches represented all the times I did not come in contact with any interface that facilitated an interaction with algorithms. The blue stitches were times I did.
Through the course of the day, I was mainly interacting with social media algorithms. The metric of success used to evaluate them is the time spent with them, their ability to “engage"- and by that definition, these were clearly successful. But then I mapped these interactions to my own emotions, categorizing how I felt- and to my surprise identified only five interactions held meaning.
There were so many times when I was interacting with algorithms because I had become habitually accustomed to them. There was no value that they were adding to my life- which made me reflect on the intent behind the algorithms- and our sustained focus on utility, productivity, and efficiency above all else.
Future Iterations
I would like to experiment with the scale of the project- in terms of the size of the visualization, as well as the time through which it sustains. If this exploration continued over weeks, even months- would the outcome look the same? It would also be interesting to include other individuals in the project to see how their “algorithm map” would differ from mine.
What I Learned
The process of working on this project was similar to developing an algorithm. Firstly, the practice of using manually recorded data has similarities with how historically biased, incomplete, or flawed data sets are used to train algorithms. Secondly, I realized that even though the data was rooted in reality, and parts of it were factual, so much of it was my own personal preferences and inclinations- including the medium for representation, the aesthetic choices being made in terms of color, contrast, and detail, as well as the conclusions I chose to draw from it.
I recognize the challenges that algorithm creators face- the “algorithm" that I had designed was true only for me, and only for that given day. If I was to try and reproduce meaning on some other day using the algorithm I had generated I would not be as successful. The failings or inadequacies of algorithms were revealed to me through the lens of my own humanness.


